Orora Limited (ORA) – NEUTRAL

ORA’s FY18 underlying NPAT of A$208.6m was up +12% on previous corresponding period (pcp), slightly ahead of consensus estimates of A$206.6m.

COMPANY DATA

Date of ReportASXPricePrice TargetAnalyst Recommendation
10/08/18ORAA$3.46A$3.55NEUTRAL
Date of Report

09/08/18

ASX

ORA

Price

A$3.46

Price Target

A$3.55

Analyst Recommendation

NEUTRAL

Sector: Materials52-Week Range: A$2.87 – 3.73
Industry: Containers & PackagingMarket Cap: A$4,211.3

Source: Bloomberg

Company Description

INVESTMENT SUMMARY

We rate ORA as a Neutral for the following reasons:

  • Attractive exposure to both developed and emerging markets’ growth.
  • Clearly defined strategy to create shareholder value.
  • Bolt-on acquisitions (and associated synergies) provide opportunity to supplement organic growth.
  • Growing exposure to the buoyant US economy.
  • Leveraged to a falling AUD/USD – with 50% of revenue now coming from North America. +/-1 cent movement in AUD/USD equating approx. -/+$1.6m impact on EBIT and -/+$1.0m on NPAT
  • Potential corporate activity.

We see the following key risks to our investment thesis:

  • Competitive pressures leading to margin erosion.
  • Input cost pressures which the company is unable to pass on to customers.
  • Deterioration in economic conditions in US, EM and Australia.
  • Emerging markets risk.
  • Adverse movements in AUD/USD.
  • Declining OCC prices.

ANALYST’S NOTE

ORA’s FY18 underlying NPAT of A$208.6m was up +12% on previous corresponding period (pcp), slightly ahead of consensus estimates of A$206.6m. However, at the operating earnings line (EBITDA) the company missed consensus estimates by approximately 2%, driven by weakness in the North American business.

North American segment saw EBIT margin decline by ~20bps to 5.6% reflecting the impact of doubtful debt provision in Orora Visual and transitional costs associated with the ERP system in OPS. The Australasia business was a standout (EBIT up +8.7% on pcp & margins up +30bps), delivering strong earnings growth despite higher energy costs.

On a positive note, ORA signed two separate power purchase agreements (PPA) with renewable energy providers to supply wind-generated electricity to ORA’s operations in South Australia, Victoria and New South Wales, securing competitive long-term supply of renewable energy for volumes equivalent to 80% of ORA’s total electricity requirements in Australia. Whilst absent in recent periods, management noted that bolt-on M&A was back in focus as a source of growth driver, with a healthy pipeline of targets built up over the past 5-6 months.

With a solid balance sheet (net debt/EBITDA at 1.5x), management has A$354m in undrawn bank debt capacity to fund acquisitions in their A$75-125m preferred range. Further we highlight ORA’s leverage to a falling Australian dollar, with +/-1 cent movement in AUD/USD equating approx. -/+$1.6m impact on EBIT and -/+$1.0m on NPAT.

  • Key drivers of market’s disappointment with ORA’s results. ORA’s share price was down post the results release, driven by:

    1. disappointing earnings outcome in the North American business, with EBIT margins declining 20bps on pcp. As a consequence, the Company missed consensus estimates by ~2% for FY18 at the operating earnings line (EBITDA).

    2. A key component of ORA’s growth strategy is bolt-on acquisitions and the absence of any M&A announcement may have disappointed the market. Management noted the ERP rollout and the integration of OV had occupied their focus. However, in our view, the positive was that ORA delivered solid organic growth in FY18, driven by internal investments.

    3. Cash conversion was lower on pcp and likely to be lower again in FY19.

  • M&A is back in focus. M&A is back on the agenda in FY19 with management noting they have built up a solid pipeline of target over the past five to six months. Further, they remain disciplined on their returns criteria, being 20% return by year 3. Management noted that M&A is likely to be in the OPS space, with opportunities in the size of A$30-40m, whilst also looking at opportunities in A$75-125m range (preferred). In their view, asset prices had not peaked yet.
  • Australasia produced a strong result. For FY18, the segment reported revenue growth of +5.2% and EBIT growth of +8.7%. We would consider this a strong result, especially considering higher electricity prices in NSW impacted earnings by $4.5m.
  • Elevated capital expenditure to drive organic growth. Management expects capex to increase over the coming years as the business looks to drive organic growth. The Company expects gross capex in FY19 to be approximately 120% of depreciation. Whilst elevated capex profile does have short term implications on cash flows, if executed well, we expect attractive earnings uplifts in future years.

ASK THE ANALYST

Our analysts are ready to answer any questions you have

FY18 Results Overview

Figure 1: : ORA Revenue by Segment

Source: BTIG, Company

Figure 2: : ORA EBIT by Segment

Source: Company; North America in AUD currency

  • Group results – Organic initiatives drive earnings forward. In the figure below, we have provided key operating metrics for the FY18 versus previous year (FY17). On an underlying basis compared to the previous corresponding period (pcp), ORA reported earnings (NPAT up +12% to A$208.6m, EPS up +11.5% to 17.4cps, EBIT of A$323.4m up +7%, and final dividend of 6.5cps (30% franked), taking the total dividend for FY18 to 12.5cps (up +13.6% pcp) and representing a payout ratio of 70.6%. Gearing (net debt/EBITDA) was down to 1.5x (from 1.6x).

Figure 3: Group FY18 key trading metrics

Source: BTIG, Company, Bloomberg

FY18 EBIT by segment – bridging the earnings gap…

Figure 4: FY18 Australasia earnings (EBIT) drivers

Source: BTIG, Company, Bloomberg

  • Australasia (50.3% revenue, 65.8% EBIT). Australasia saw revenue up +5.2% to $2,104.8m over the pcp, and EBIT up +8.7% to $232.3m over the same period, which we consider solid growth despite flattish economic and market conditions and higher input costs. EBIT margins also saw an increase of +30 bps to 11.0% over the pcp. The strong EBIT jump could be attributed to earnings growth in Fibre Packaging and Beverage business (which saw improved reliability and production performance at B9 Recycles Paper Mill, and sales growth in targeted market segments.
  • North America (49.7% revenue, 34.2% EBIT). Relative to the pcp, North America saw revenue up +5.2%, EBIT up +3%, and in local currency terms, revenue grew +8.1% and EBIT was up +5.9%. EBIT margin declined 20bps to 5.6%, reflecting the impact of the doubtful debt provision (US$2.2m) in Orora Visual and transitional costs associated with the ERP system in OPS. Management expects input cost pressures for labour, freight and paper to continue into FY19.

Figure 5: FY18 North America earnings (EBIT) drivers
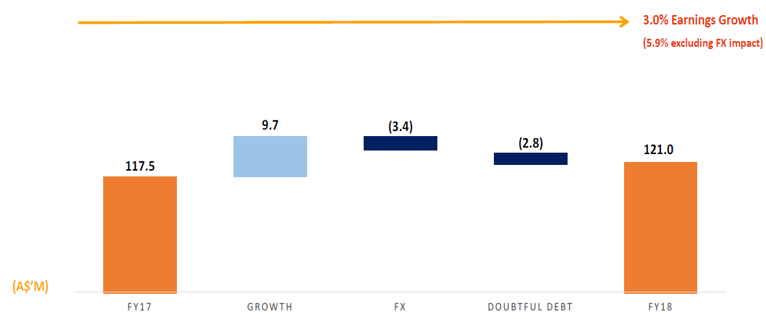
Source:Company

  • Elevated capital expenditure to drive organic growth. ORA invested A$189m, during FY18 in organic capital projects and innovation, including A$30m in the ongoing Australasian Fibre Packaging asset refresh program. Management expects capex to increase over the coming years as the business looks to drive organic growth. The Company expects gross capex in FY19 to be approximately 120% of depreciation including investments in asset refresh programs in Fibre Packaging and OPS.
  • Outlook – flat trading conditions ongoing but higher earnings expected in FY19. ORA provided little guidance for FY19, stating that it expects ongoing flat market conditions and risk of rising inflationary pressures in North America. Management expects “to continue to drive organic growth and invest in innovation and growth during FY19, with constant currency earnings expected to higher than reported in FY18, subject to global economic conditions”.

Valuation

We value ORA using three methods: DCF (A$3.81), EV/EBITDA (A$3.70) and PE-relative (A$3.26). Our 5-year forecasts assume on a CAGR basis: revenue growth of +4.4% p.a., operating earnings growth of +6.0%; and EPS growth of +7.8% p.a. For our relative valuations, we use peer group consensus estimates for ORA, Amcor (AMC) and Pact Group (PGH). We arrive at a price target of A$3.55, which is the average of our three valuations (rounded to the nearest five cents). On our estimates for FY19, ORA is trading on a PE-multiple of 18.9x and yield of approximately 3.7%.

Figure 6: ORA Financial Summary

Source: BTIG, Company, Bloomberg

COMPANY DESCRIPTION

Orora Limited (ORA) provides packaging products and services. The Company offers fiber, glass and beverage can packaging materials in Australia and Asia and packaging distribution services in North America and Australia.

This Week’s News

Analyst Research

1 March 2020

Could regenerative agriculture and high quality Australia proteins be Australia’s key to environmental and economic viability?

Analyst Research

14 August 2019

HiTech Group reports another record result in FY 2019

Analyst Research

7 August 2019

Identitii Limited (ID8)

General Advice Warning

Any advice provided by Reach Markets including on its website and by its representatives is general advice only and does not consider your objectives, financial situation or needs, and you should consider whether it is appropriate for you. This might mean that you need to seek personal advice from a representative authorised to provide personal advice. If you are thinking about acquiring a financial product, you should consider our Financial Services Guide (FSG)

including the Privacy Statement and any relevant Product Disclosure Statement or Prospectus (if one is available) to understand the features, risks and returns associated with the investment.

Please click here to read our full warning.